

cửa hàng trực tuyến
đặt dịch vụ
sự kiện
cửa sổ bật lên

- 10%
Area Chart
Của
Area Chart and Graph for Data Visualization
Chưa có bài đánh giá nào
14 ngày dùng thử miễn phí




Tổng quan về Area Chart
- Show trends at a glance: turn rows of numbers into an area chart your visitors read easily
- Keep your data current: type values in the settings panel, or feed the chart from a JSON link or Velo code
- Compare series: add several lines to one chart and give each a solid or dashed stroke
- Match your design: adjust the chart style so the graph fits the look of your brand
Tình trạng sẵn có:
Ứng dụng này sẵn có trên toàn thế giới.Ngôn ngữ ứng dụng:
Tiếng Anh
Xếp hạng & đánh giá
Ứng dụng này chưa nhận được bất kỳ đánh giá nào, hãy là người đầu tiên xếp hạng ứng dụng.Giá và gói
Ứng dụng này cung cấp bản dùng thử miễn phí 14 ngàyGói Premium
- 10%
$
1
34
/tháng
$149
Showcase Your Line Charts With Ease
Various Types of Area Charts
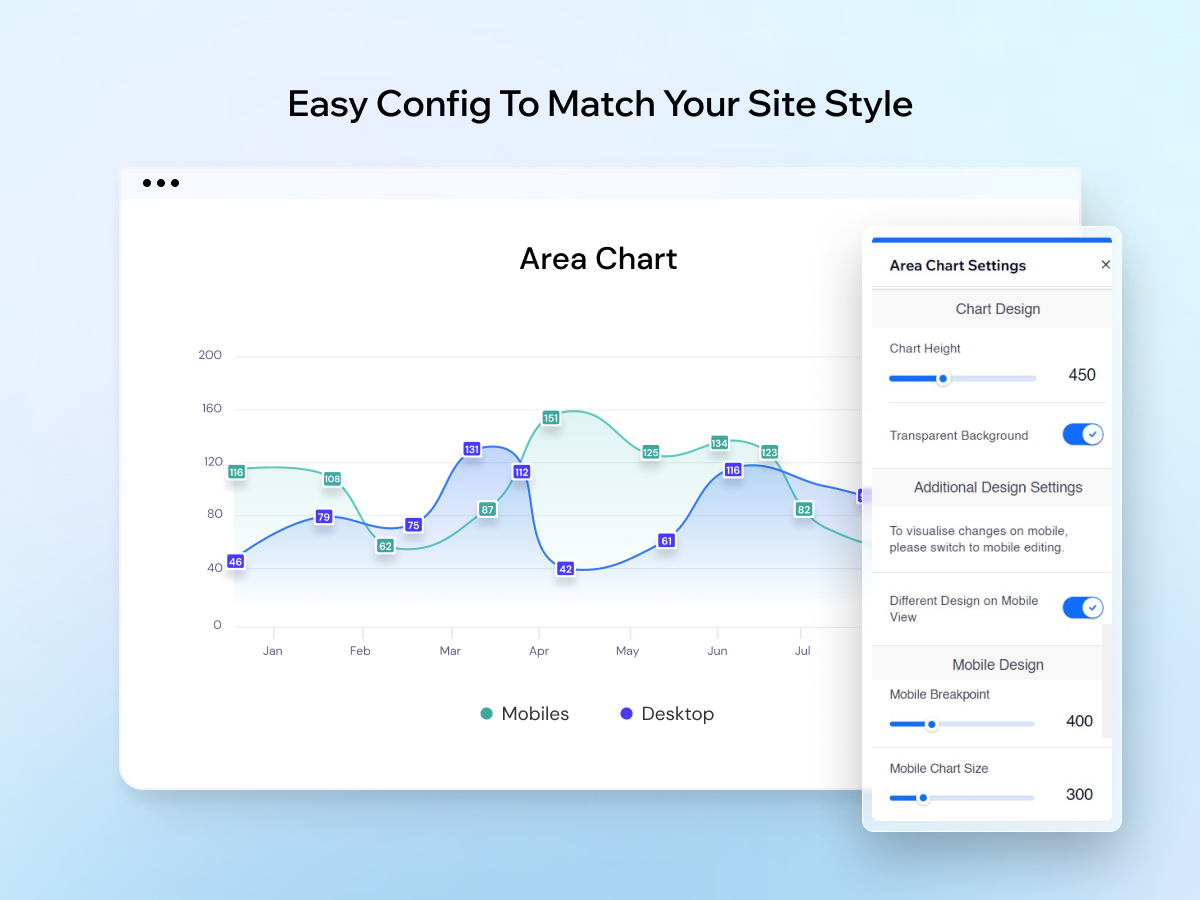
Easy Config To Match Your Site Style
* Giá tính bằng USD.
* Ưu đãi này có hiệu lực đến 23:59 8 tháng 11, 2026 theo giờ UTC. Nhà phát triển ứng dụng có quyền kết thúc ưu đãi bất cứ lúc nào và điều khoản của chương trình có thể thay đổi.